
A reader who wishes to remain anonymous is tracking Covid cases using the daily John Hopkins numbers and is now sending me the data, a very kind gift. These numbers are the confirmed numbers. Credible reports are coming in that not all deaths are being properly attributed, and of course, we really don’t know how many people have the virus.
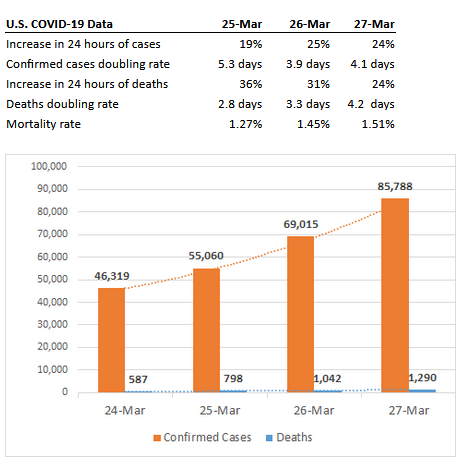
I’d suggest that the doubling rates are what to keep an eye on.
The results of the work I do, like this article, are free, but food isn’t, so if you value my work, please DONATE or SUBSCRIBE.
StewartM
According to New Scientist an antibody test–critical to assessing the scope of the pandemic–could be ready “in days” in the UK, at least.
That would be key development in fighting the pandemic. If you can determine who’s already had it and gotten over it (mild cases, mistaken for colds or flu, or symptom-less) then while such people might not be completely immune (after all, the thing mutates, just like a cold or flu virus) these people probably would have greater immunity and could work the higher-risk jobs.
edwin
There are three sites I use for data:
John Hopkins CSSE data. https://91-divoc.com/pages/covid-visualization/
(original source naked capitalism water cooler)
https://coronawiki.org/
and
https://www.youtube.com/watch?v=qgylp3Td1Bw for that real time depression.
Willy
Credible sites for data? Bah!
In a brave new world where all one has to do to be a sanctioned winner within The Order of the Mindless Ballyhoos, is to be on the right team, repeatedly proclaim ones greatness, and call ones opponents rude names, I proclaim myself the best commenter ever with a very very large brain!
Except I’m not rich which sorta ruins all that. Plus I’ve never done reality TV so never mind.
So here comes the next Trump scapegoat, Dr. Deborah Birx, to spout whatever nonsense pops into her head as whispered by the Trumpian winners. All is well she says, except where it isn’t. This thing cannot be possibly more contagious than the common flu because we say so. So take that you kung flu naysayers.
Dan Lynch
As of this moment 10.6% fatality rate in Italy for all cases. 45% fatality rate for closed cases. That’s some serious shit! (from the worldometers website)
UK now estimating that the virus’ reproductive ratio might be 3.0 or even higher. Hence extreme measures may be needed to reduce the ratio to less than 1.0.
BlizzardOfOzzz
Total deaths creeping up towards 2,000, so almost within an order of magnitude of the average flu season. Almost at the level where you would notice it, if you weren’t already looking for it.
Charlie
US just passed 100,000 cases according to Worldmeter and we’re just getting started. Italy recorded over 1,000 new deaths just in the last 24 hours.
https://www.worldometers.info/coronavirus/
Stormcrow
Note to Ian:
If you don’t already know this …
Doubling time changes show most easily if the case data is plotted on a
log scale.
The horizontal axis is divided into equally spaced days (or whatever
measure of time you’re using).
But the vertical axis is divided into equally spaced powers of some
number, usually powers of 10.
There’s a comparative graph of epidemic trajectory/acceleration by
country at Coronavirus
map of the US: latest cases state by state. That map is in
log scale:
notice the tick marks on the vertical axis.
That’s what you want to look at when you’re comparing local epidemics.
Ten Bears
Are you saying, Blizzard, as you have of the grieving community and dead children of Sandy Hook, that all these people dying are crisis actors, and like the children at Sandy Hook are not dead?
Stirling S Newberry
The dark is crawling up.
Charlie
On that note, It’s probably a good thing I’m likely to die soon (not COVID related). I continue seeing people becoming less and less humane (or even sociable) toward one another and that has gone exponential since the pandemic and lockdowns began. This trend appears it will worsen the longer it goes.
gnokgnoh
@charlie, I’m seeing just the opposite. People are sewing hospital masks and taking food to hospitals (Philly area). They’re making lunches and taking groceries to the elderly and over-tipping for takeout. My son is about to be called up early for residency, because they need doctors. He will go. It’s terrible that we have to make protective equipment for doctors and nurses, this shouldn’t be the case, but there is no hesitation to help.
Charlie
@gnokgnoh
Health care workers are the new “support the troops” group that PR will focus on. It’s not that they aren’t important during a pandemic, but at the same time they are not (and have never been) a marginalized group in our society. My own dealings with the health care system involves my urologist informing me they will not treat me until the emergency orders have been lifted in spite of the fact that their in-patient office remains open. I was told they were only reserving time for “more established patients.” Of course, in our profit rules all health care system, that means patients with more money. Now, given the health care workers will make decisions on who lives and who dies, we know who will die during this pandemic. The poor and marginalized. That means lower income or jobless, people with dark complexions, those outside the “norm” in sexual orientation, and other groups.
Health care workers as a rule have not been as privy to the drawbacks of social isolation either nor subject to stay at home orders when they happen. Social isolation being a form of torture per Geneva Conventions, and this may last months. Therefore, it will get much worse before it gets better.
Hugh
It is not like we are seeing the worst case scenario. That would be if we had a demented intensely ignorant, wildly opinionated, raging narcissist running/sabotaging the response to the coronavirus. See. I bet you’re feeling better already.
metamars
If the number of tests being taken were a constant, this graph would be very interesting. However, the tests have been surging. (I don’t know what the details are, but I do know that we went from about 2,000 total tests, when S. Korea was doing thousands per day, to more done than any other country.)
Think of it this way. If the rollout of tests were exponential, then even with a constant rate of new infections, we’d expect to see an exponential increase in confirmed cov-id cases. (Of course, the situation is more dynamic, and uncertain, than that. I’m tacitly assuming the testing capture of new cases is a smallish fraction of the actual cases, which are not, and cannot, be known to be such, without a test.)
Please take a look at “A Swiss Doctor on Covid-19” @ https://swprs.org/a-swiss-doctor-on-covid-19/ , which is updated, daily. I basically skimmed it, but it appears to be mostly statistical analyses. From the intro, to get a good idea of the how damaging the virus will prove to be, one needs to look at the excess mortality:
“Thus the most important indicator for judging the danger of the disease is not the frequently reported number of positively-tested persons and deaths, but the number of persons actually and unexpectedly developing or dying from pneumonia (so-called excess mortality).
According to all current data, for the healthy general population of school and working age, a mild to moderate course of the Covid-19 disease can be expected. Senior citizens and persons with existing chronic diseases should be protected. The medical capacities should be optimally prepared.”
From today’s update, these 2 entries seem particularly important:
The two Stanford professors of medicine, Dr. Eran Bendavid and Dr. Jay Bhattacharya, explain in an article (Paywall) that the lethality of Covid19 is overestimated by several orders of magnitude and is probably even in Italy only at 0.01% to 0.06% and thus below that of influenza. The reason for this overestimation is the greatly underestimated number of people already infected (without symptoms). As an example, the fully tested Italian community of Vo is mentioned, which showed 50 to 75% symptom-free test-positive persons.
Dr. Gerald Gaß, President of the German Hospital Association, explained in an interview with the Handelsblatt that „the extreme situation in Italy is mainly due to the very low intensive care capacities“.
So, if the virus spreads faster than normal flu, and ICU capacity is already low, one expects to see nightmare scenarios of maxed out hospitals, even if the excess mortality turns out to be lower than seasonal flu (or would have turned out to be lower, if everybody got proper care, including a ventilator, when called for.) Another confounding factor is that time required on a ventilator is much longer than compared to influenza. (I think Cuomo made that point. Fortunately, he managed to shame Trump into expediting ventilator creation.)
The HQ + ZPAC combo is more effective in early stages to prevent ARDs, to begin with, but even if it ‘only’ cuts time on a ventilator in half, for those who progress to that stage, it would still be a game changer.
======
BTW, I thought Cuomo, who is obviously a better crisis manager and communicator than Trump, would be a strong candidate for the Democrats to run. While he probably would be, after listening to a Democracy Now segment on what happened to hospital capacity in NY under his leadership, it’s clear he’s also vulnerable to charges of health mismanagement.
capelin
what charlie said. + #support our cashiers.
capelin
stormcrow – it seems to me that the john hopkins graph of “number of new cases by country” at the gardian link is a fairly useless peice of data. it needs to be per capita, not straight numbers.
the italy and usa trajectories would look quite a bit different. italy has 60million people; at 330million the us has 5.5 time more people.
am i imagining things, or did i just flatten america’s curve?
Stormcrow
capelin –
A per capita graph won’t change the overall shape of the curve, and the information most critical to understand what’s happening to the epidemic resides in that shape.
In order to see what’s happening, you want to represent the case data in a way that makes “constant acceleration” look like a straight line.
That way, a deceleration will appear as a downward curvature, and an increase in the acceleration will appear as an upward curvature.
You can see none of this from a straight graph of cases versus time, whether it’s represented per capita or not.
Astrid
The trends can be seen by going to https://www.worldometers.info/coronavirus/ and selecting the country. Look at the log scale graph. For italy, the slope of increase is decreasing. For the US, it’s holding a straight line progression.
Even assuming the stricter quarantine measures, most of which were put in after St. Patrick’s Day, started having an effect. The effects won’t be seen for another 4-7 days in hospitals. Actual reporting may be another week after that as labs are now taking a week to run the tests. By then there could be 100,000+ new reports everyday nationally. Except there probably won’t be, because there won’t be the testing capacity and people realize that going to an overwhelmed hospital won’t improve mortality but will ensure that you or your estate will go bankrupt on the other end.
Astrid
One thing that bugs me is the talk of ventilators when front line staff don’t have PPE. Apparently the survival rate for intubated Covid19 patients is 10-50 percent, and the patients will likely emerged with dimished lung capacity and major health effects on the other end. In times of triage, this looks like a terrible place to focus attention and resources on.
Meanwhile, quarantine and effective PPE keeps infection and thus mortality at zero. So all the talk about expensive (to buy and operate) and high lead time ventilators seem to be an intentional distraction from basic public health precautions that governments and hospitals are still flaunting.
Ché Pasa
Right now, because medical supplies and equipment are practically unavailable at all, there seems to be a lot of reinvention of the wheel going on. “Makers,” “Innovators,” and “Disruptors” all over the world are trying to figure out how to design and build face shields and masks and ventilators and all kinds of stuff the marketplace doesn’t have. Distillers and perfumers are making hand sanitizer and distributing it to first responders because the market provides none whatsoever. To anyone. Home sewers are making masks and gowns for hospital staffs because there are nearly none in the marketplace or they aren’t being distributed for some unexplained reason. The problem of gloves might not be solvable in the short term as Malaysia forbids export and materials are not easily obtainable.
There’s nothing wrong with these efforts, but the question is why is the marketplace so completely bereft not only of product but apparently of manufacturing, distribution and delivery, so much so that the only option in many cases and places is DIY. Hoarding is part of it, but it’s almost as if the manufacturers ceased operations the moment the crisis was foreseen. It’s like they’re not trying to play catch up so much as they’re not manufacturing at all and instead GM and home tinkerers have to figure out how to do it.
Something ain’t right…
metamars
“So all the talk about expensive (to buy and operate) and high lead time ventilators seem to be an intentional distraction from basic public health precautions that governments and hospitals are still flaunting.”
I would agree with the above, if you removed the word “intentional”.
After listening to this Korean expert, we should also also be wearing masks when in public (at least). He made the point that we may have been told in the US that they’re not necessary because they wanted to conserve them for medical professionals. https://www.youtube.com/watch?v=gAk7aX5hksU&fbclid=IwAR1CjleWG2CKKQNL3t42-mVhbH3loVOHaniRJNZ8UrFLVQlhMwxL-CLl1ns
capelin
there problem with the #cases/country graph is not whether it’s in log scale or not.
“how the us compares to other countries” at https://www.theguardian.com/world/ng-interactive/2020/mar/27/coronavirus-map-of-the-us-latest-cases-state-by-state
the problem is the _comparing of big countries and little countries.
look at it this way: if you combined, say, singapore and japan into the country of singpan, and then put it back on the graph, the curve would be way steeper.
and if you divided america down the middle into two countries, and graphed that, their curve would be way flatter, because the total number of cases – in each county – would be ~half.
that graph is worse than useless, it’s misleading.
capelin
and for further context, flue/pnemonia has killed 20-60 000 people in the america this year.
https://www.cdc.gov/flu/about/burden/preliminary-in-season-estimates.htm
early days of c19, but still.
capelin
and worldwide, 10 000 per day deaths from air pollution.
https://www.forbes.com/sites/rogerpielke/2020/03/10/every-day-10000-people-die-due-to-air-pollution-from-fossil-fuels/
–
Z
The cynical take on the bill is this: the corporate handouts to Wall Street and corporate America were going to be engineered by the Federal Reserve anyway. They are already handing Blackrock trillions of dollars to support Wall Street and would keep pumping until they got what they wanted. There’s no accountability in that either. So, now it’s just Mnuchin feeding it into corporations in a different way. Woop-dee-doo.
Z