
Basically, not at all.
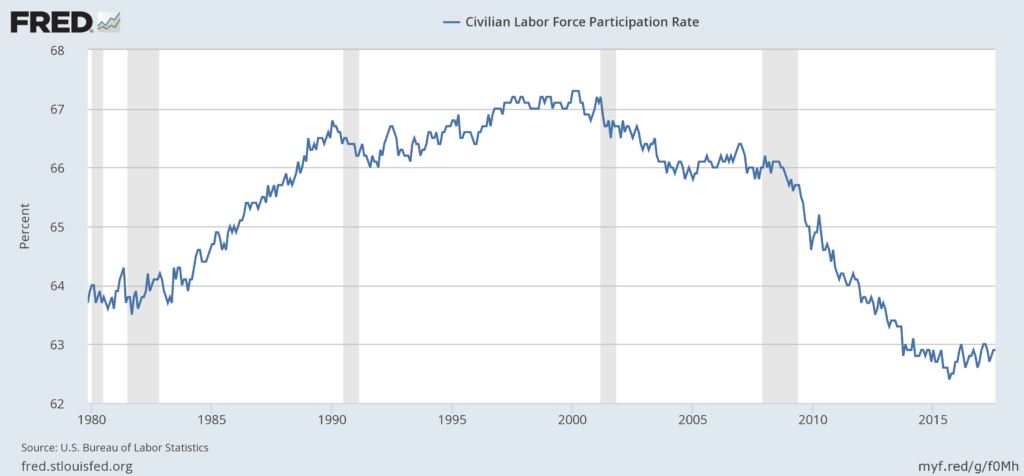
Labor Force Participation Rate
So, around 1980, wages go off a cliff. Americans respond by increasing the number of two earner households, because from 1980 onwards, the Federal Reserve deliberately limits wage increases for most workers so they always come in under the inflation rate.
Then the 2008 financial crisis happened, and those jobs went away. Wages haven’t improved, for most people they are even or down.
In 2009, I predicted a collapse in incomes. I got it partially wrong. I held the labor force participation rate steady and expected reductions to come out of wages. Instead, the reduction came mostly from jobs just going away. (In retrospect this was a clumsy mistake.)
So, lately you’ve been hearing about how wonderful the economy is. It isn’t. It’s still shitty for most people and has been shitty since 2008.
Obama’s didn’t fix the economy. He froze it at approximately where it was after the financial collapse, minus a dead cat bounce, which is to be expected since he and the Federal Reserve and Treasury did everything they could to not allow price discovery to happen and to not allow capitalism to do one of the things it does well, when left alone: make bankrupt companies go bankrupt and wipe out bad loans.
Instead they made sure that companies and people who had caused the financial collapse, in most cases deliberately, were made whole and prevented from losing everything, while pushing the losses down onto homeowners who were minor participants compared to Wall Street and large banks.
This has played out as stagnation. It is exacerbated by a host of other issues, like monopolization, corruption and the declining era of oil, but at heart it is a simple refusal to let large, politically powerful actors take their losses and lose the economic power they misused.
Having done everything wrong from 2000 to 2008 except buy Congress, financial interests afterwards kept doing everything wrong except buying politicians, because they won big-time, and the most important rule of capitalism is: “If you’re making lots of money, keep doing what you’re doing.”
When making money is, in effect, guaranteed, capitalism stops working in anything close to a beneficial fashion.
This was, again, Obama’s decision. When TARP was first proposed it failed to pass and only did so because Obama bent arms, viciously, to make it happen. He was 100 percent on side with everything Bernanke did, and not only did nothing to stop him, but aided and abetted him in what were crimes by any reasonable definition of the word.
The economy is bad. It is has never recovered from the financial collapse, and it will not do so until both austerity and crony capitalism are dealt with.
The results of the work I do, like this article, are free, but food isn’t, so if you value my work, please DONATE or SUBSCRIBE.
Adam Eran
Worth a look:
http://dy00k1db5oznd.cloudfront.net/wp-content/uploads/2014/09/Screen-Shot-2014-09-29-at-11.29.04-AM.png
Who got the fruits of recovery. The Obama recovery is by far the worst for the bottom 90% of incomes (although the decline began with Reagan)
bruce wilder
If I understand the argument you are making correctly, what you want in place of the chart you are showing is the Civilian Employment to Population ratio.
What you are showing is the civilian labor force participation rate, which is defined as the percentage of the population that is either employed or unemployed.
The Civilian Employment to Population ratio, which is the portion of the adult population (16 years and older) that is employed seems more on target. That chart is available from FRED
https://fred.stlouisfed.org/series/EMRATIO
It is a more dramatic illustration of your thesis.
This one from FRED via Wikipedia is also useful: It compares Employment to population with the unemployment rate.
https://en.wikipedia.org/wiki/Employment-to-population_ratio#/media/File:Unemployment_and_employment_statistics_for_the_US_since_2000.png
Alex
“Obama’s didn’t fix the economy. He froze it at approximately where it was after the financial collapse”
Well, a case can be made that he, like Clinton, massaged the numbers to hide things.
The BLS numbers:
Not in Labor Force
Jan 2009: 80,529,000
Dec 2017: 95,102,000
added 14,573,000
This accomplished the illusion of full employment with low headline (U3) unemployment numbers.
Shadowstats had the following unemployment numbers:
Feb 2009: 19.1%
Jan 2017: 22.9%
Labor Force Participation Rate:
Jan 2009: 65.7%
Dec 2017: 62.7%
The GDP:
Never had a year above 3% (only president since Hoover)
The absurdity of the BLS numbers is they (like Not in Labor Force) can be updated for up to five years afterwards.
And then there’s the Piketty/Saez chart:
https://twitter.com/JustinWolfers/status/514907147638157312
1-1/2 years ago, I wrote “A Critical Eye on Obama’s Jobs and Unemployment Record”:
http://newdealprogressives.org/blog/2016/03/06/a-critical-eye-on-obamas-jobs-and-unemployment-record/
In my opinion, Obama is the Hoover for the Democrats, considering Dems lost 1042 seats at federal and state levels, and who knows how many at local levels, probably another 1000.
Ian Welsh
I did use the labor force participation rate deliberately. Unemployed means actively looking for work. Those are the people who think they can get work. The people who have dropped out matter a great deal.
Still, either can do, yes, and perhaps employment ratio is better. But it’s not a big deal either way.
Alex
Ian, the biggest story not being told are the details about how income is being distributed upwards.
For instance, under Bush, there were four wars going on (Afghanistan, Iraq, Pakistan, Somalia); under Obama there were 18 countries (at last count) where the US was fighting wars.
http://newdealprogressives.org/blog/2016/07/16/fight-club-the-u-s-wars-continue-to-increase-in-number-exponentially/
I ball-parked the amount of money spent on (1) defense spending and (2) tax breaks, et al since 2001, and these are the number I came up with:
1. $38,655,190,993,638 ($38.65 trillion)
2. $38,862,045,270,361 ($38.86 trillion)
The total for these numbers is:
$77,517,236,263,999 ($77.51 trillion)
http://newdealprogressives.org/blog/2016/07/07/honest-campaign-if-elected-i-promise-to-give-trillions-to-the-rich-spend-trillions-on-war-and-cut-everything-for-working-people/
Almost nothing is being said about that.
Btw, here’s one I get amused at:
http://newdealprogressives.org/blog/2016/08/03/u-s-is-240-years-old-and-it-has-spent-over-469-years-fighting-wars-list-of-u-s-wars-at-home-and-abroad/
The amount of money the US has spent on foreign and domestic wars since 1776 can’t even be counted.
Phil Perspective
Alex:
Shadowstats are 95% garbage.
Herman
Yes spot on. The only people I know who think we are in a good economy are in the top 10 percent of income earners, maybe the top 20 percent if we want to stretch it out to the maximum. Everyone else I talk to feels that the recession never ended because for them that is an accurate description of the current state of the economy.
The people in the top 10-20 percent are who most Democrats want to win over now in addition to minorities. I have talked to many Democrats who believe that they don’t need the white working class to win elections in the future because demographics will make their alliance of affluent white liberals and non-whites unbeatable. To them all white working-class people are nasty, Archie Bunker-style bigots and they deserve whatever miserable fate awaits them. These same people then wonder why the far right is on the rise. Unbelievable.
Ten Bears
We have to stop doing what we doing. It isn’t working.
John Poynton
Right sentiment – wrong analysis. The fall in living standards in both the US and UK is due to massive trade deficits. This requires international action to correct these imbalances across the globe, caused by globalisation. Exchange rates no longer automatically adjust to bring trade back into balance because currency flows are now swamped by capital movements. We need a new successor to Bretton Woods, probably based on allowing the WTO to set maximum import tariff rates per country proportional to each county’s trade deficit.
Rd
“When making money is, in effect, guaranteed, capitalism stops working in anything close to a beneficial fashion.”
Isn’t what you describe in the article what capitalism is all about? making money (at all cost). Perhaps a different terminology may be more apt, Corporate planned economy vs free market economy.
bruce wilder
No not a big deal either way, I agree.
The side-by-side of the unemployment rate and employment ratio since the recession tells an important story: the unemployment rate falls steadily while the employment ratio scarcely rises. People were not finding work in a expanding economy; they have been giving up.
And, seeing the employment ratio since 1950 adds perspective to the story of expanding employment in the 1980s and the slide more recently.
The hard part, politically, is getting people to see that this is a consequence of policy choices, political choices and doing so in a way that is at least minimally sophisticated. Not a story of tax breaks for job creators or the miraculous effects of educational credentials on life-time earnings, or even a story of financialization of the economy and globalization of trade. We bury political struggle under a mountain of symbols and personalities, and obscure policy with senseless economic theories, jargon and statistics. Then, we look back on trends as in this post, and we see the outcomes. The timing, the coincidence with elections or economic crisis tells us things changed and change had consequences. But, it still doesn’t give us control going forward. The economy still seems something that happens to us, like the weather and the trends just prove that changes in the economic climate happen and may be caused but not how to control it.
Ian Welsh
While trade is a significant issue, and one I have written about in the past, the massive fall off of employment after the fin. crisis did not have trade as its proximate cause.
When we want to have a good economy that helps everyone again we will have it. Until we do, we won’t.
Willy
When making money is, in effect, guaranteed, capitalism stops working in anything close to a beneficial fashion.
The trick these days is to work for a company with a strong lobbying presence. And then when the inevitable capitalistic failure results in ruining your more honest competitors, you can gleefully say: Fuckem!
If you go into a medical clinic there are no signs behind the receptionist telling you how much their most popular services and products are going to cost you, like you’ll see at a McDonalds. Hell, the doctors don’t even know when you ask them. They’ll tell you duh but they can perform it in a jiffy. Then a week later you open up your bill to find out your 10 minute mole removal was called a “surgical procedure” and they want $900.
That’s the ticket. Only work for places that know how to extract serious bank from stupid and naïve people who believe that’s the way the system should be because “that’s the way it is everywhere”. Leave nickel and dime competitiveness to the honest little burger flippers.
Alex
Phil:
Shadowstats is one source. It catches flak for GDP calcs, but not unemployment. I find the ones tearing into SS are mainly MSM hacks defending the establishment line of “prosperity is just around the corner”. Yes, of course it is.
The BLS is producing some very questionable numbers and has been by not counting unemployed people.
Go back to the Great Depression and unemployment was calculated very straight forward:
Labor Force Unemployment Rate = unemployed / labor force
For 1933, it was 24.75% = 12,830,000 / 51,840,000
http://www.u-s-history.com/pages/h1528.html
Today, the numbers go into a black box and voila, a full employment number comes out. Yes, of course it does.
At the current trend, we’ll have negative unemployment rates which means there are more jobs than people.
What makes it even more ridiculous is some BLS number can be changed for up to 5 years afterwards.
Obama only created 10,479,000 jobs over eight years. Nothing to write home about.
I asked Mike Kimel (Angrybear contributor and Presimetrics author) about Obama and he said:
Obama has broken the patterns of behavior we noted in the book, at least when it comes to the economy. He has maintained GW’s tax policies, particularly early on. He dealt with the Great Recession the way GW was doing it rather than the way FDR did it, so the economy has grown GW-ish (i.e., lukewarm) rather than FDR-ish (i.e., an actual bounce back from a major downturn that included several years of the fastest peacetime real economic growth in this country’s history).
Alex
Last thing, if we used the current BLS unemployment calcs, unemployment during the Great Depression would’ve been 1.7%.
The irony is that some of the New Deal programs were created by Hoover; he just couldn’t get himself to implement them because of his ideology. John Norquist, author of The Wealth of Cities, wrote about this.
StewartM
Alex
They were? The Great Depression unemployment stats weren’t calculated ‘in a very straightforward manner’ at all, they were based upon Stanley. Lebergott’s estimations, as real, hard, data did not exist during most of the depression. Lebergott’s employment stats excluded people who served in the armed forces and people who had relief work as not having ‘real jobs’ so his unemployment figures have been criticized as inflated.
StewartM
Actually, all the heavy breathing about the civilian participation rate is misplaced. It was higher in the Reagan economy than the FDR economy. Declining real wages which force entire households to work when one wage-earner used to be sufficient is not progress, and in fact represents a significant decrease in leisure and in quality of life.
bruce wilder
My point above — about how, even if we can see meaningful trends like those highlighted in the OP, the economy still seems to conventional wisdom as something chaotic and impossible to predict let alone control — is well-illustrated by collective memory of and even professionally-written histories of the Great Depression.
I do not think there is commonly available, a good, sound understanding of what the Great Depression was, and what caused the Great Depression as an economic event; nor how the New Deal addressed those causes. I am not saying I understand it and you, dear Reader, do not. I know some things, but I do not have a lot of confidence in my depth of understanding. I am saying that there isn’t a good shared historical view, and, in particular, Left views of economics and economic history is particularly impoverished by not having any well-informed consensus view. The reactionary Right has had some ideas — most famously, Milton Friedman’s monetarist blame-the-fed narrative — to combine with their general hostility to the New Deal reforms. But, left-liberal views seemed to have withered in the 1960s and died out in the 1970s, the memories simply gone from politics. Galbraith to Polanyi were, imho, somewhat weak analyses, and then, they just fell out of memory entirely.
Ian says, “When we want to have a good economy that helps everyone again we will have it. Until we do, we won’t.” I wonder, who is “we”?
The Great Depression and the New Deal was one long political struggle, which continued in stalemate thru the 1930s — a struggle over the distribution of resources, wealth, power and income, and because of the imperatives of the War, the liberal-left ended up largely winning that fight. But, it was largely a stalemate up to 1938-39 — Lebergott’s unemployment numbers reflect the sense that that was the case, a sense that faded during and after the War.
Some people — powerful people — really do not want “a good economy” as Ian Welsh or I would understand “good”. “A good economy” for the many would be an obstacle rather than a means to their power and status, the power and status of the 0.1%. So, “a good economy” for the many requires not just wanting it idly, but being able and willing to organize politically to fight for it.
Being willing to fight for a good economy and actually getting a good economy also depends on having clear, sound ideas of what institutional means to a good economy can be devised and put into place.
Some good ideas are beginning to emerge: $15/hr minimum wage, single-payer. Some may not be all that sound (MMT, I am looking at you) and others, like a path to dismantling the global free-trade regime or a new concept of antitrust or new approaches to policing property ownership are barely emergent.
Politics is a fight, and often a knife fight in which you cannot trust your friends — et tu, Brute and all that! Post-2016, it is pretty clear that many in the professional classes — the 10% — are eager to protect themselves and their relationships with the plutocracy, the 0.1% The rich have gone from hiring half the working class to imprison the other half, to hiring more than half the professional and managerial classes to starve and imprison the rest of us. So, lots of scorn for the unwashed, less-credentialled masses from the new bourgeoisie; lots of “it’s complicated” claims whenever anyone threatens the complex supply-chains of globalized trade (alongside charges of racism against the deplorables, natch).
We may want “a good economy” but we are not going to get it from the erstwhile supporters of Hillary Clinton and the Democratic Establishment, any more than we are likely to get it from Donald Trump.
Alex
Stewart:
The BLS has been keeping stats on one thing or another (wage, cost of living, unemployment, etc) since the late 1800s. Around WWI they started identifying unemployment data (rough to be sure) because they were concerned how the US compared to other countries.
The First 100 Years of the Bureau of Labor Statistics
https://archive.org/details/TheFirst100YearsOfTheBureauOfLaborStatistics
As far as the Labor Participation Rate, they only have records back to 1948:
https://data.bls.gov/timeseries/LNS11300000
bruce wilder
Just to clarify a point I wanted to make in my previous comment, but then lost track of:
Ian’s statement, “When we want to have a good economy that helps everyone again we will have it. Until we do, we won’t.” is a sentiment that applies to the 10%, the well-educated professional and managerial classes who have the means to conceive of and implement a good economy, but choose to conceive and implement instead the neoliberal utopia sought by their patrons among the global super-rich and powerful business corporations. These are the people who organize the political process, staff the bureaucracy public and private, people the Media as executives and pundits, supply our opinions and provide authoritative “expertise”.
Alex
Stewart:
“Declining real wages which force entire households to work when one wage-earner used to be sufficient is not progress, and in fact represents a significant decrease in leisure and in quality of life.”
Yep. By now, we should have 28 hour work weeks for real life-work balance (8h x 7d = 56h / 2).
We’ve been going backwards.
Bruce:
We have what we have today because the 1% are following John C Calhoun’s and James Buchanan’s ideas. There is little to no opposition to this by the public.
bruce wilder
Alex: “the 1% are following John C Calhoun’s and James Buchanan’s ideas. There is little to no opposition to this by the public.”
I do not know about Calhoun, but presuming you refer to faux nobelist, James McGill Buchanan, Jr. and not the antebellum President, then possibly. The 1% have benefited from the advice and ideological propaganda of some very conservative economists. And, there has been remarkably little effective pushback from the soi disant left, either on an elite level or popularly.
This asymmetry, where class warfare has been carried on by one class only, is the story of neoliberalism. In academia and in the political media and elsewhere, the left quit the field and the right carried on.
Paul Krugman presents himself as a liberal, but he is, in fact, also a conservative economist. When Ben Bernanke was brought in to manage the then prospective financial crisis, very few nominal Democrats expressed concern, and even after he had done the deed expected of him, he got the support of Krugman, Mark Thoma and others for Obama’s renomination of him. Obama pressed for TPP to the end of his term. I could go on and on, about all manner of wonky reforms that have served to dispossess the masses, from the end of usury to the bankruptcy reform Hillary supported to resale price maintenance to ip law to the now pervasive circumvention of the corporate income tax. That the left complain of the abstract and bloodless “inequality” instead of more passionately attacking specific predatory patterns is an indication of how little appetite for a fight exists.
Hugh
The denominator for both the participation rate and employment to population rate is the civilian noninstitutional population over 16. As the name implies, it does not include active duty military or those held in jails and prisons. As far as I know, the BLS did not start keeping consistent records of these stats until the late 1940s.
The participation rate increased in the 80s as more women entered the job market. Two and multiple earner households also increased. It is important to note, however, that the labor share of income for the bottom 80% of households peaked in 1968.
Baby Boomers began hitting 65 in 2011 and this has contributed to the decline in participation rates. However, if you look at Ian’s graph, you see that the participation rate began its decline around 2000, much earlier than this. So it isn’t just about the Boomers.
In historical comparisons, it is important to remember that the economy changes making such comparisons difficult. Certain aspects of the Great Depression remain relevant, but some, such as overall population, women’s place, or lack of place, in the labor force, degree of urbanization, technological level, and gold standard monetary system do not. The Great Depression rhymes with current conditions, but it does not directly echo them. If you go further back beyond the Great Depression toward the turn of the century, you have an economy that has little reference to what we have now. What has been happening since the late 90s-early 2000s is that the economy has been changing in significant ways in terms of income, wealth distribution, investment, globalization, and offshoring and the BLS, and its stats, have not kept up.
Alex
Bruce:
Yep, you’re 100% on the mark. I hope people learn a lesson about fake Democrats like Obama and Clinton, but most have short attention spans.
**
Hugh:
I agree with most of that. But some things don’t change, and manipulating numbers to hide the bad, is common through the ages.
One of the very first things I wrote about back in 2013, was the boom-and-bust cycles of the US ( http://newdealprogressives.org/blog/2013/08/11/what-a-21st-century-new-deal-would-look-like/ ):
—
There are six other depressions on record in the US since 1789:
1807-1810
1815-1821
1837-1844 (the Long Depression)
1873-1879
1893-1898
1920-1921
There have been 47 recessions on record since 1790. What the MSM (mainstream media) and politicians call The Great Recession of today is actually another Long Depression with unemployment reaching Great Depression levels.
—
The US needs to change its’ economic system.
Btw, the BLS has jobs data back to Jan-1939 ( https://data.bls.gov/timeseries/CES0000000001 )
and
GDP data back to 1930 ( https://bea.gov/iTable/iTable.cfm?reqid=9&step=3&isuri=1&904=1930&903=1&906=a&905=2016&910=x&911=0#reqid=9&step=3&isuri=1&904=1930&903=1&906=a&905=2016&910=x&911=0 ).
So they were keeping track of some things back then.
During the Ford admin in 1975, they created Not in Labor Force ( https://data.bls.gov/timeseries/LNS15000000 ).
It remained steady from Jan-1975 with 58,627,000 to Dec-1992 with 65,230,000, an increase of 6.6 million.
During Clinton’s term, it jumped 4.6 million to 70,489,000 and by Dec-2016 it jumped 24.6 million to 95,102,000. It’s apparent that Clinton & Rubin made changes that caused the increases in NILF and lowered the unemployment rate.
In 1994, they also created Marginally Attached Workers and Discouraged Workers; more buckets to hide unemployed workers.
In 2013, Obama ordered the BLS to stop counting mass layoffs.
I would say the BLS probably needs to update some things, but it has had some undue influences on it which caused the current problems.
Ultra
It is risky to make a sweeping inference about the state of the economy on the basis of a single economic statistic. The labor force participation rate can be influenced by more things than the availability of jobs. Here are some examples:
1) Plenty of jobs may be available, but workers may lack the skills to perform them as our economy becomes more specialized.
2) A change in human culture may deemphasize the importance of work. People may decide that work involves more hassles than it is worth, or because of the growing importance of extended education, more people may be going to school, rather than working, as compared to the past.
3) A decline in birth rates means smaller family sizes, therefore work may be viewed as less necessary for one of the parents in two-parent families.
4) Because of demographic changes, the percentage of people who are either 15 and under or 65 and older may increase, causing a decline in the percentage of people who are of working age.
5) The government may be losing its ability to keep track of employment (particularly self-employment) because of the information revolution. People are able to earn money from the internet in ways that were unavailable in the past and difficult to monitor.
6) Illegal immigrants and their employers are less likely to report their income to the government. Therefore, if there is an increase in illegal immigration in the United States that displaces legal workers, this could cause the labor force participation rate to decline, as reported by the government.
7) The number of legal immigrants entering the US can affect the labor force participation rate. Because most legal immigrants are of working age, an increase of legal immigration into the US could increase the labor force participation rate (assuming native-born workers are not displaced). When the number of legal immigrants declines, this tends to decrease the labor force participation rate.
Miscellaneous comments:
In the United States, the male labor force participation rate has been steadily falling since the 1950s (it used to be around 90%). This statistic can’t be explained by the current state of the economy.
The female labor force participation rate has steadily increased until recently. Now it is also starting to decline.
The labor force participation rate for young people aged 16-25 has fallen off a cliff, even though there is no shortage of low-paying jobs for such workers. The only plausible explanation is that more of them are going to school, or perhaps they are less interested in participating in the workforce if they don’t have to. Also, fewer young people in that age group are obtaining driver’s licenses, which could make it more difficult to obtain employment.
On the other hand, the labor force participation rate for people aged 55 and older has been increasing. This could be because older people are in better health than was the case in the past, or they failed to save enough money for retirement in order to live comfortably, or because they have large bills to pay off because of the spiraling cost of health care in the US, or because of a change in employers’ attitudes toward the elderly, or any number of other things.
Hugh
Alex, the CES (Current Employment Statistics) comes from the Establishment/business survey. It is the one I tend to use more now. The CPS (Current Population Survey) is much smaller, much less accurate, but often better at showing near term shifts in the labor force. It is the one that measures the participation rate and employment to population ratio.
Ultra,
re 1), the jobs/skills mismatch has been largely debunked. If such mismatches occurred and were significant, they would show up within industry sectors, but real unemployment, not the fictitious metric the BLS currently is using, occurs across industry sectors. And, of course, industry has always had two very good solutions to such mismatches where they occur: train current workers and pay them well enough to keep them. *gasp* I know how shocking.
re 2), are these the same workers who are getting extended education for jobs that don’t exist? Those who can afford such a route are increasingly from the top 20%. The rest of us have to eat which rather increases the emphasis on work.
re 3), declining birth rates have been offset by increased immigration. Also more than 15% of the current US labor force is foreign born.
re 4), the civilian noninstitutional population over 16 already does not include those under 16. As I noted above, there is a Boomer effect on the overall participation rate, but it doesn’t explain the decline in participation rates among younger workers.
re 5), the CPS is a self-reporting survey and does measure the self-employed. So it very likely would pick up such increases. Thing is the number of self-employed has not been showing any dramatic increases. I forget but would guess that currently the self-employed account for less than 10% of the labor force. Their numbers have changed little over the past 15 years.
re 6), the CPS does track foreign born workers, but not their legal status. The CES does neither. The civilian noninstitutional population is over 250 million. So a 1% change in the participation rate involves over 2.5 million people.
re 7), don’t understand the point. See 6).
Jim Quinn
I hate Obama as much as the next guy, but TARP was passed while Bush was still president. Obama didn’t take office until January 2009.
Ian Welsh
TARP failed until Obama, the Democratic nominee, twisted arms with Democrats to make it pass. Pelosi was originally unwilling to have a larger percentage of Dems vote for it than Republicans.
That is a FACT.
I was covering this shit very closely at the time.
Without Obama’s arm twisting, there is no TARP.
He owns it.
realitychecker
Word.